The most common reason behind the error “Uncaught ReferenceError: $ is not defined” is executing the jQuery code before the jQuery library file has loaded. Therefore make sure that you’re executing the jQuery code only after jQuery library file has finished loading.
<template>
  <div>
    <div id="chart-container">FusionCharts XT will load here!</div>
  </div>
</template>

<script>
// Include the core fusioncharts file from core
import FusionCharts from 'fusioncharts/core'
// Include the chart from viz folder
import Column2D from 'fusioncharts/viz/column2d'
// Include the fusion theme
import FusionTheme from 'fusioncharts/themes/es/fusioncharts.theme.fusion'
// Add the chart and theme as dependency
// E.g. FusionCharts.addDep(ChartType)
FusionCharts.addDep(Column2D)
FusionCharts.addDep(FusionTheme)
</script>
// Create a JSON object to store the chart configurations
const chartConfig = {
// チャートのタイプ
type: "column2d",
// Set the container object
renderAt: "chart-container",
// Specify the width of the chart
width: "100%",
// Specify the height of the chart
height: "400",
// Set the type of data
dataFormat: "json",
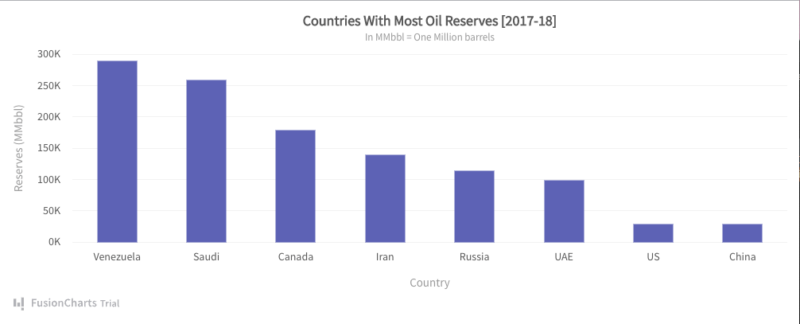
dataSource: {
chart: {
// Set the chart caption
caption: "Countries With Most Oil Reserves [2017-18]",
// Set the chart subcaption
subCaption: "In MMbbl = One Million barrels",
// Set the x-axis name
xAxisName: "Country",
// Set the y-axis name
yAxisName: "Reserves (MMbbl)",
numberSuffix: "K",
// Set the theme for your chart
theme: "fusion"
},
// Chart Data from Step 2
data: chartData
}
};
![[jQuery]エラー:Uncaught ReferenceError: $ is not defined](https://nolyc.net/wp-content/uploads/2022/06/811330-1.png)
![[git]既に作成したディレクトリ名を変更](https://nolyc.net/wp-content/uploads/2022/04/git.png)
![[Nuxt.js]FusionCharts導入覚書 – Plain javascript編](https://nolyc.net/wp-content/uploads/2022/05/nuxtfusion.png)