Nuxt.jsでFusionChartsを入れたので、その覚書。
最初はVueフレームワークで導入を試みようとしたのですが、エラーが消えなかったので断念。VueとNuxtの超えられない壁を感じたのですが、githubにnuxtで動かしている人もいて、多分nuxtでも動かせるんだろうけど、私の知識不足により実現できていません。
先輩の偉大な助けにより、vue dependencyをプラグイン化することで解決しました。ありがたやありがたや。
ちなみに該当githubはこちら。プロジェクトをDLして動かしたら、選択できる地図が現れました。気になる方は動かしてみてください。
https://github.com/ICJIA/fusioncharts-test
Plain JavaScriptで動かす
というわけで、シンプルにPlain JavaScriptで動かすことにしました。
公式のGet Startedはこちらです。
https://www.fusioncharts.com/dev/getting-started/plain-javascript/your-first-chart-using-plain-javascript
前提条件
npmでfusionchartsをインストールする場合は、Node.jsのインストールが必要です。
インストール
CDN、ローカルファイル、npmのそれぞれでインストールする方法があります。
CDNの場合は、nuxt.config.jsのhead: { script: [ {src: ”,}, ],}部分にcdnソースを2つ、盛り込みましょう。
  head: {
    script: [
      // Step 1 - Include the fusioncharts core library
      {
        src: 'https://cdn.fusioncharts.com/fusioncharts/latest/fusioncharts.js',
      },
      // Step 2 - Include the fusion theme
      {
        src: 'https://cdn.fusioncharts.com/fusioncharts/latest/themes/fusioncharts.theme.fusion.js',
      },
    ],
はい。
私はnpmでインストールしました。
既存のnuxt.jsプロジェクトディレクトリで、npmを叩くだけ。先に最新のwebpackを入れておきます。
$ npm install webpack webpack-cli --save-dev
$ npm install fusioncharts
テンプレートを用意
pages>fusioncharts>index.vueを作成し、templateを用意。必要なdependencyをimportします。
<template>
  <div>
    <div id="chart-container">FusionCharts XT will load here!</div>
  </div>
</template>

<script>
// Include the core fusioncharts file from core
import FusionCharts from 'fusioncharts/core'
// Include the chart from viz folder
import Column2D from 'fusioncharts/viz/column2d'
// Include the fusion theme
import FusionTheme from 'fusioncharts/themes/es/fusioncharts.theme.fusion'
// Add the chart and theme as dependency
// E.g. FusionCharts.addDep(ChartType)
FusionCharts.addDep(Column2D)
FusionCharts.addDep(FusionTheme)
</script>
これで準備完了です。
データを用意
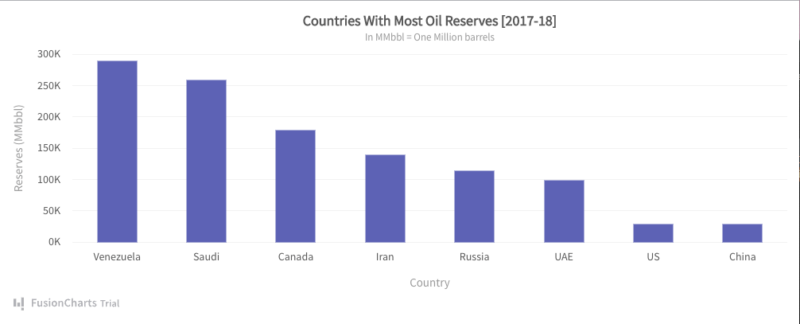
チャートを作成するにはデータが必要ですね。例として、ここでは世界の石油保有国とその量を示した2D chart を表現することにしましょう(公式に沿ってるだけですよ)。
<script></script>内importの下に、chartDataを定義します。x軸となるデータラベルをlabel、y軸となるデータバリューをvalueとして、オブジェクトにします。この辺はconstants/define.jsとかに書いてindex.vueでimportした方がnuxtっぽいけど。
// Preparing the chart data
const chartData = [
  {
    label: "Venezuela",
    value: "290"
  },
  {
    label: "Saudi",
    value: "260"
  },
  {
    label: "Canada",
    value: "180"
  },
  {
    label: "Iran",
    value: "140"
  },
  {
    label: "Russia",
    value: "115"
  },
  {
    label: "UAE",
    value: "100"
  },
  {
    label: "US",
    value: "30"
  },
  {
    label: "China",
    value: "30"
  }
];
チャート設定
データが用意できたので、いよいよ次はチャートの設定部分です。以下では公式の例をそのまま載せていますが、掲載されているオプションを元に色々カスタマイズができます。
// Create a JSON object to store the chart configurations
const chartConfig = {
  // チャートのタイプ
  type: "column2d",
  // Set the container object
  renderAt: "chart-container",
  // Specify the width of the chart
  width: "100%",
  // Specify the height of the chart
  height: "400",
  // Set the type of data
  dataFormat: "json",
  dataSource: {
    chart: {
      // Set the chart caption
      caption: "Countries With Most Oil Reserves [2017-18]",
      // Set the chart subcaption
      subCaption: "In MMbbl = One Million barrels",
      // Set the x-axis name
      xAxisName: "Country",
      // Set the y-axis name
      yAxisName: "Reserves (MMbbl)",
      numberSuffix: "K",
      // Set the theme for your chart
      theme: "fusion"
    },
    // Chart Data from Step 2
    data: chartData
  }
};
FusionChartsをmoutedで描画
最後に、FusionChartsをMountedします。
export default {
  mounted() {
    FusionCharts.ready(function () {
      console.log('passed FunctionChart')
      const fusioncharts = new FusionCharts(chartConfig)
      fusioncharts.render()
    })
    console.log('mounted!')
  },
}
npx nuxtした際の見た目

